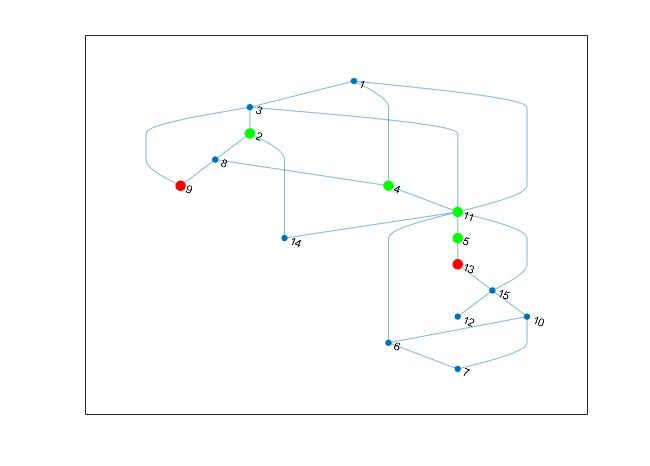
Hell everyone I have been trying to read through this forum for the methodology to approach a graph/network problem. The idea is I have an undirected graph, and every node is capable of talking to any node it wants through any path. Give a set of source nodes and set of sink nodes, I need to find the minimum number of nodes to remove that will sever all source nodes from all sink nodes.
I have been trying to read a lot on the Min Cut (s-t) max flow problem, but I can't seem to figure out how to apply it to a scenario with multiple sources / sinks.
I have a set of MATLAB code below that creates a pseudo-random graph as an example. So I need to figure out which nodes to remove so green can not reach red.
*Note that both red and green nodes are allowed to be transition nodes for other pathways as well.
close all;clearvars;clc
% Create an Example undirected/unweighted graph
nNodes = 15;   % number of nodes
pLink  = 0.08; % probabilitiy off link between to verticies

adjMat = rand(nNodes) <= pLink;    % Create adjaceny matrix
adjMat(eye(nNodes)==1) = false;    % Remove any self loops or connetions

adjMat = (adjMat + adjMat')/2;     % Make adjaceny matrix symetric


good_graph = all(sum(adjMat)>=1);  % Also to check all nodes are connected

while ~good_graph %Loop until good graph
    adjMat = rand(nNodes) <= pLink;    % Create adjaceny matrix
    adjMat(eye(nNodes)==1) = false;    % Remove any self loops or connetions

    adjMat = (adjMat + adjMat')/2;     % Make adjaceny matrix symetric
    good_graph = all(sum(adjMat)>=1);  % Also to check all nodes are connected
end

G = graph(adjMat); %Create Graph

% Number of random source and sink nodes
nSource = 4;
nSink   = 2;

nodeList   = 1:nNodes;

SourceList = randperm(length(nodeList));
SourceList = SourceList(1:nSource);

nodeList(any(nodeList == SourceList')) = []; %Remove source nodes

SinkList   = randperm(length(nodeList));
SinkList   = nodeList(SinkList(1:nSink));

%% Plot Graph
gg = plot(G,'Layout','layered'  ); % plot graph - Also to check all nodes are connected

highlight(gg,SourceList,'NodeColor','g','MarkerSize',7);
highlight(gg,SinkList,'NodeColor','r','MarkerSize',7)
