2
$\begingroup$

I have a simple optimization problem and would like to solve it using Microsoft Solver. However, the solver does not do what it is supposed to.

Briefly to the background: In the problem the gross salary for the year 2021, 2022 and 2023 is given. Income-related expenses in the amount of 17,000.00 € are to be distributed in such a way that as much of the tax as possible is reimbursed. That is, the payments must be distributed over the year so that the amount that can be reimbursed via the tax is as high as possible.

For this I have now assembled several lines.

  1. salary before: Is the sum of the gross salary in the respective year.
  2. taxes before: The income tax to be paid on the salary according to the formula given (in the cell).
  3. payments: The sum of payments to be paid per year (total 17000 after 3 years).
  4. salary after: is the amount of the row salary before minus the amount of payment.
  5. taxes after: Are the income taxes that are due on the salary from line 4 (again, according to the formula of the cell).
  6. taxes saved: The difference between what I paid in taxes before (line 2) and what I would have to pay after deducting the income-related expenses (line 5). The sum of this is on the right.

The sum from the line Taxes saved should now be maximized with the solver. This is my target variable (F11). My variables are the cells B6:D6. The constraint is that the sum of the payments (F6) must always be 17.000,00 €.

The solver also calculates, but the result is wrong. It simply divides the payments evenly over all 3 years, one third each.

My question is, why does it do that and how can I get the solver to maximize the sum of the saved taxes?

Here is the excel: https://drive.google.com/file/d/188mPFDB1f3OiQTlTBvbIsAUDTRgiflma/view?usp=sharing.

Many greetings and thanks
$\endgroup$
1
  • $\begingroup$ It would be great if you could share the mathematical formulation of your problem. It gives more chance to be answered your question. :) $\endgroup$
    – A.Omidi
    Commented Jul 14, 2021 at 10:23

1 Answer 1

4
$\begingroup$

There are different solvers in Excel that are suited for different types of problems:

  • Simplex LP
  • GRG Nonlinear
  • Evolutionary

The Simplex LP solver is the only solver that can guarantee an optimal solution, however, the problem size is somewhat limited and all of the constraints as well as the objective function have to be linear.

Your problem is small, however, there are non-linear equations:

  • the IF function is non-linear
  • Within the IF statements you have quadratic equations (Welcome to bureaucracy. Germany?)
  • You are rounding the tax payments (=INT(....))

The rounding probably won't be necessary, so this is an easy one. The IF function is deadly in this context and can be eliminated (see piecewise linear functions) using additional variables.

At this point, a solver like Gurobi could solve it since it supports quadratic terms under certain conditions. However, the Excel Simplex solver still can't do it. You could approximate the quadratic part using more piecewise linear functions, however, the problem will get way to big to model it in a reasonable way in Excel.

So, what about the other solvers? Both the GRG nonlinear solver as well as the Evolutionary solver are based on heuristics. These solvers aren't guaranteed to find an optimal solution and aren't even guaranteed to find a solution at all. I use them once in a while, but most of the time it isn't even worth trying.

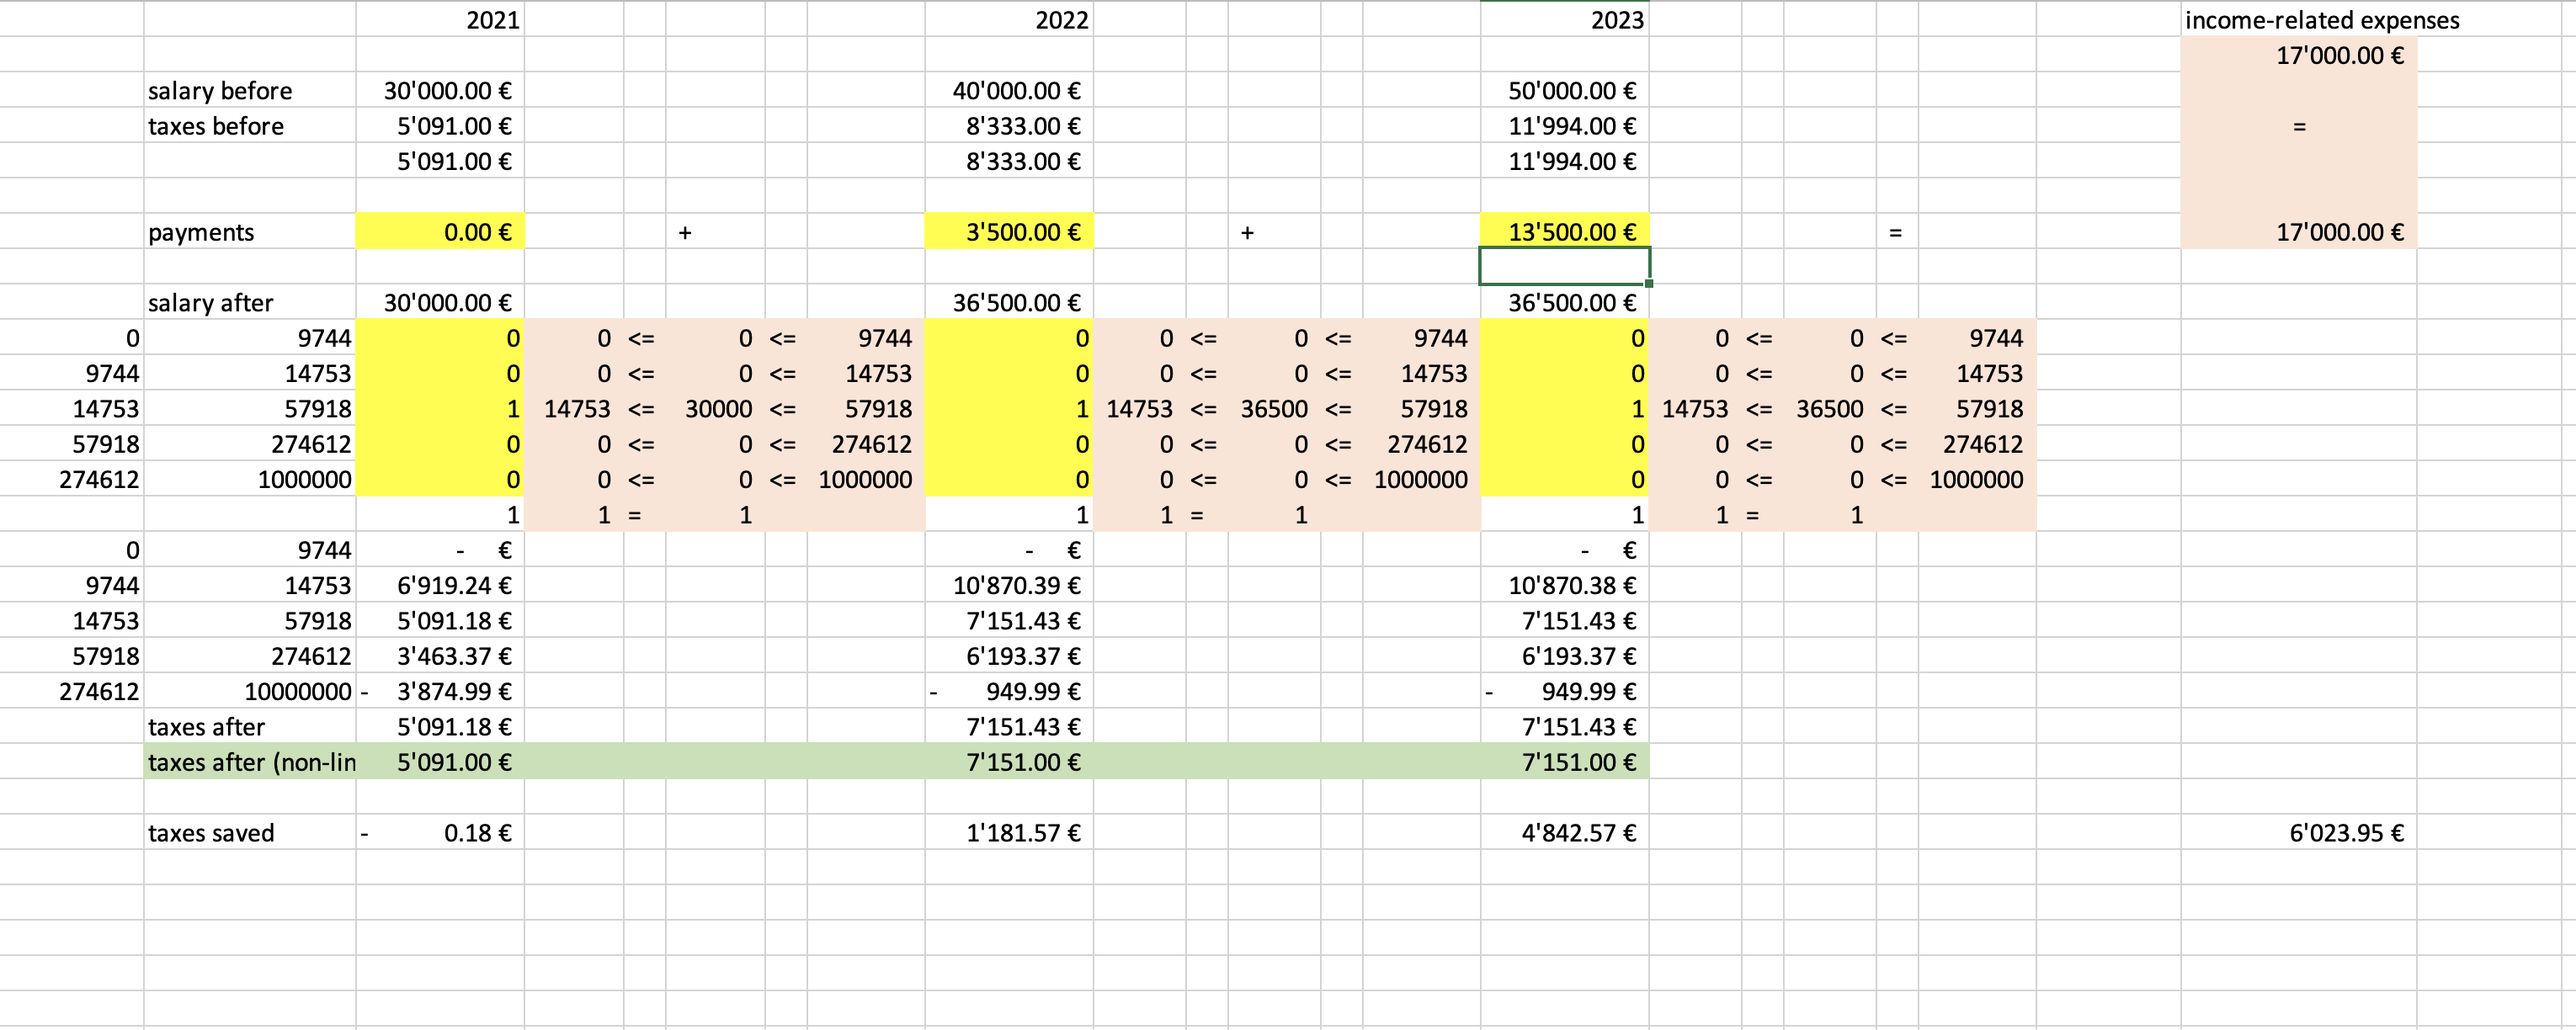
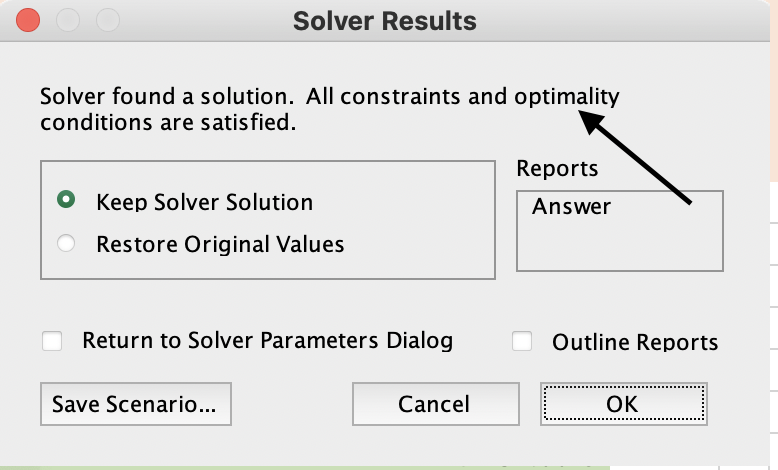
In your case, I have used only the modelling tricks to get rid of the IF function (see piecewise linear function) and then used the GRG nonlinear solver. I was lucky and was able too find an optimal solution, which I didn't expect. The solver is usually letting you know if the solution is just "feasible" or if it is also optimal (like in this case):

Optimal solution found

The optimal solution is as follows: The optimal solution

As you can see in the screenshot above, I have completely changed the way the tax payments are calculated. Instead of having one formula, I calculate the "potential" tax that would be due in each tax bracket. Furthermore, I introduced a binary variable for each year and tax bracket. This variable is 1 if the taxable salary is in the given range and 0 otherwise. All variables are yellow and all formulas that need to be added to the solver are in orange. The green line contains the "old" calculation using the "IF" statements. I kept this in there in order to verify that the new calculation is implemented correctly.

For your reference, here's the file after my modifications: https://drive.google.com/file/d/1pBFCyF8MvtIEJh7PXxNglwBvigXX3Kn1/view?usp=sharing

If you want to do this for more years or for more complicated tax formulas, this approach probably won't work and you won't get around using a modelling language and a commercial solver.

$\endgroup$
1
  • $\begingroup$ Thank you so much @Walter! Your answer is incredible! And yes, welcome to Germany.. I hate it $\endgroup$
    – Jan
    Commented Jul 14, 2021 at 14:42

Your Answer

By clicking “Post Your Answer”, you agree to our terms of service and acknowledge you have read our privacy policy.

Not the answer you're looking for? Browse other questions tagged or ask your own question.